NanoBeacon™ BLE Scanner Tutorial (Part 4)
So far, we have published three tutorials on using our new NanoBeacon™ BLE Scanner mobile app. We covered the following topics:
Introduction to the NanoBeacon™ BLE Scanner mobile app
Installation and setup
Overview of the different features of the app
How to use the mobile app to discover your IN100 tags
Overview of device filters
The differences between the iOS app and the Android app
App notifications for detecting triggered advertising sets
In this tutorial, we will cover the “Logs” and “Monitor” features of the mobile app (available in the latest version of the app)
Let’s get started!
Logging Feature
First, make sure you have the latest version of the app (whether that’s for iOS or Android).
Once you have the latest version installed, go ahead and launch the app.
For a simple test case, we’ll be configuring the IN100 with the following parameters:
One advertising set
Advertising Data
Advertising data format: Custom
Device Name: “IN100”
Manufacturer Specific Data: VCC, Internal Temp
Advertising Parameters
Advertising Interval: 100 ms
Once you have the parameters set as above, make sure you probe and connect to the device, then click “Run in RAM.”
Finally, import your IN100 configuration from NanoBeacon™ Config Tool (via the QR code) into the mobile app.
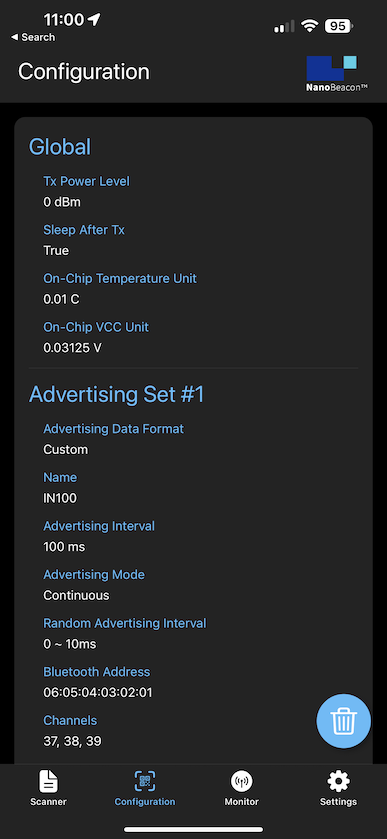
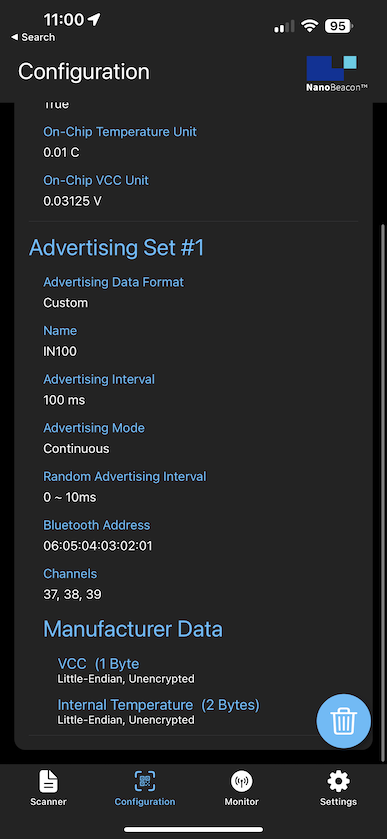
Now that we have the configuration imported into the mobile app, we should see the following in the “Configuration” view:
Verify that the configuration is correct, and then navigate to the “Scanner” view.
Once in the Scanner view, enable the filter “Only show project configuration matches”:

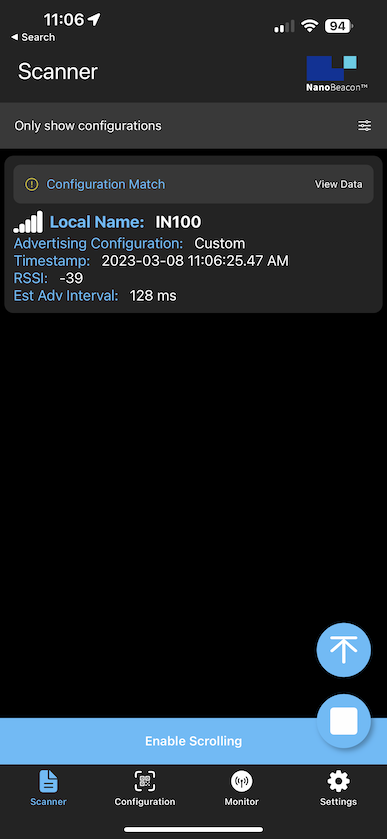
Now, exit the filter view and refresh the scan. You should see the following on screen:
Now, click on the “View Data” text to see the detailed real-time advertising data:

From here, notice the “Logs” button in the top right corner of the screen. Click on it, and now you should see a real-time log of the captured data. Basically, this shows the history of all the advertising data captured by the app. Once in this view, you’ll also notice that there’s an export button in the top right-hand corner of the screen:
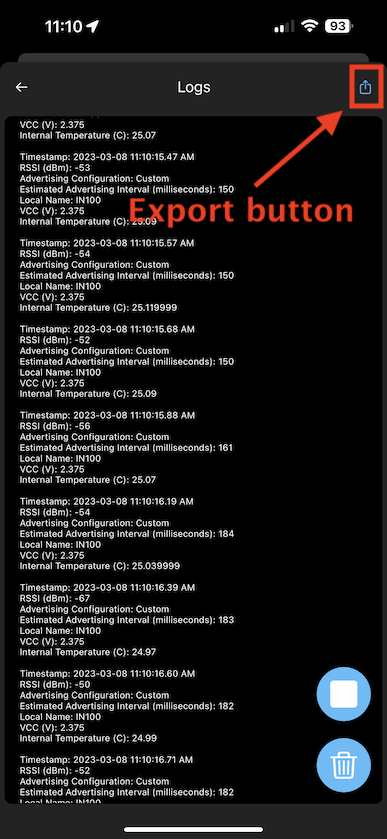
This allows you to export the full log via email, clipboard, and other methods supported by your device:
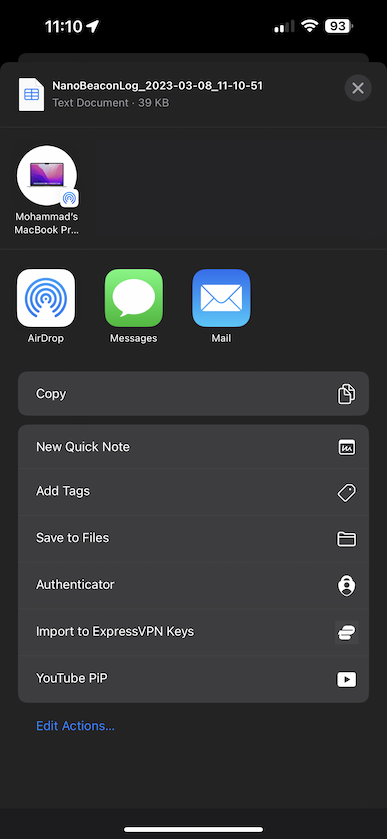
The exported format is in CSV (comma-separated values), so you can easily import it into Excel or any other spreadsheet app you choose.
You’ll also notice two other icons in the bottom right-hand corner of the screen, the trash icon ( 🗑️ ) and the stop icon ( ⏹️ ). These allow you to stop/continue/start the logging and also clear the logs, respectively.
Here’s what the exported log data looks like in Excel:

As you can see, this is a very powerful feature that allows you to take your data outside the app and perform any data analysis you wish!
Now, this is great for continuous advertising data sets where you’ll always find the advertising set captured by the mobile app, but what about triggered advertising sets (if you’re unfamiliar with the concept of Triggered advertising sets in NanoBeacon™, I encourage you to read our last tutorial on the topic, found here).
Let’s see how we can view logs for triggered advertising sets!
Monitor View
If you’ve used previous versions of the mobile app, you’ll notice that this is a new view that was just added recently.
The view allows you to see the last captured advertising data sets as well as the history/logs of the captured data. This can be very powerful, especially in the case of Triggered advertising sets, where the advertising sets are not always present. It is also a much more convenient way to view the logs for all configured advertising sets outside of the Scanner view.
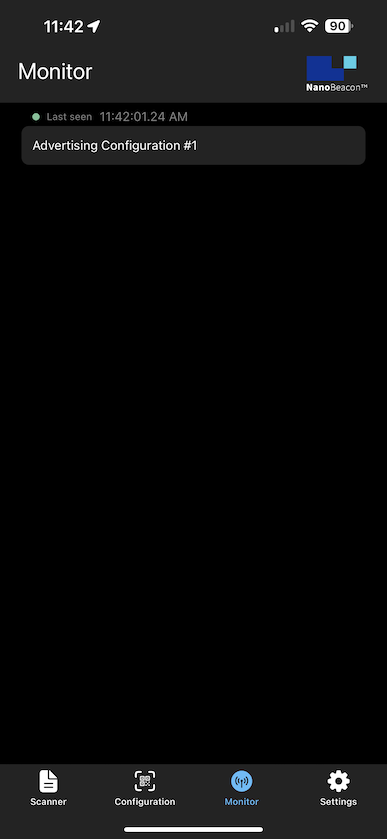
For our configuration example that we used in this tutorial, if we navigate to the Monitor view, we’ll notice the single advertising set that we configured:
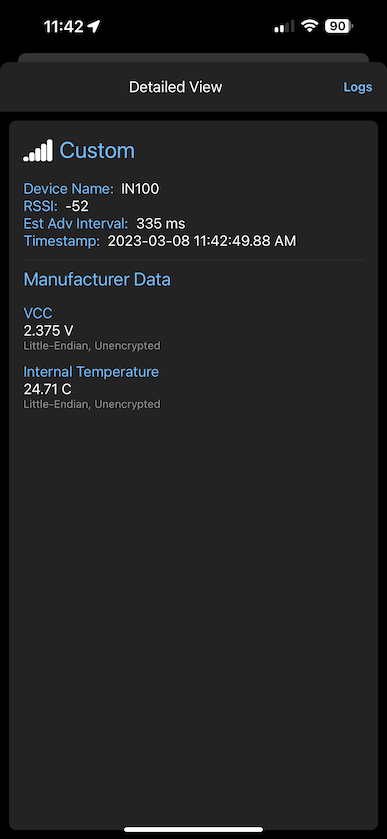
If we click on it, we’ll be taken to a view that’s identical to the one found when you click on “View Data” in the Scanner view. The data shown here is updated in real-time:
You’ll also notice you have the “Logs” button which will allow you to view the history of the data captured by the mobile app:

One cool experiment to run is to turn off your IN100 device (or simply take it out of range), verify that the device is no longer being discovered in the Scanner view, and then navigate to the Monitor view to see the log data for the advertising set.
You’ll also be able to see the data included in the last-captured advertising set and see the timestamp it was captured at.
Summary
In this tutorial, we focused on the Logging feature of the app and showed how you can view the logs in two ways:
From the Scanner view —> View Data —> Logs
From Monitor view —> click on Advertising Set of interest —> Logs
Stay tuned for more tutorials covering new features that get added to the mobile app!